Category:Genes on human chromosome 1
Jump to navigation
Jump to search
human chromosome  | |||||
| Upload media | |||||
| Instance of | |||||
|---|---|---|---|---|---|
| Subclass of |
| ||||
| Part of | |||||
| Length |
| ||||
| Followed by | |||||
| |||||
Genes encoded on human chromosome 1
Subcategories
This category has the following 19 subcategories, out of 19 total.
C
- C1orf106 (15 F)
- C1orf127 (7 F)
- C8 complex (1 F)
D
- DYRK3 (2 F)
G
- GADD45A (2 F)
- Glycogen debranching enzyme (7 F)
- GNAI3 (7 F)
I
- Interleukin-19 (2 F)
L
N
R
- Rap GTP-binding proteins (12 F)
- RPE65 (4 F)
S
- Serum amyloid P component (1 F)
- SHC1 (4 F)
T
- Thyroid-stimulating hormone (3 F)
Y
- Y-box-binding protein 1 (7 F)
Media in category "Genes on human chromosome 1"
The following 58 files are in this category, out of 58 total.
-
 2g7i.jpg 1,000 × 797; 328 KB
-
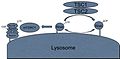 Activation of mTORC1 at the Lysosome.jpg 1,972 × 970; 119 KB
-
 ALS Disease Pathology and Proposed Disease Mechanisms.jpg 1,052 × 1,280; 194 KB
-
 Annotated FAM76A Transcription Factor Binding Sites .png 742 × 733; 419 KB
-
 ATP13A2.png 120 × 120; 6 KB
-
 C1orf123 Hypoxic Condition.png 300 × 485; 22 KB
-
 C1orf194 Location.png 230 × 1,125; 150 KB
-
 CCTOP prediction.png 686 × 93; 16 KB
-
 Conceptual translation of TMCO4 1.jpg 1,275 × 1,650; 376 KB
-
 Conceptual translation of TMCO4 2.jpg 1,275 × 1,650; 220 KB
-
 Esquema de les interaccions establertes per LIGHT i consequencies.jpg 1,152 × 720; 89 KB
-
 Esquema que mostra les consecuències de la unió de DcR3 a LIGHT.png 598 × 319; 32 KB
-
 Estrés oxidatiu mitocondri.png 819 × 557; 130 KB
-
 Estrés oxidatiu.png 819 × 547; 138 KB
-
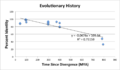
 Evolutionary History of C1orf131.png 573 × 291; 17 KB
-
 Factor h binding protein.jpg 3,389 × 2,688; 851 KB
-
 FAM231B Chromosome Location.png 1,010 × 116; 10 KB
-
 FAM76A .png 754 × 425; 43 KB
-
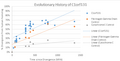
 FAM78B-Evolutionary-History-Graph1.png 1,044 × 613; 68 KB
-
 FHAD1 location.jpg 960 × 540; 19 KB
-
 Fosforilació HtrA2.png 575 × 394; 19 KB
-
 Fosforilació TRAP1.png 562 × 354; 11 KB
-
 Gen FLG.jpg 1,416 × 777; 99 KB
-
 Gene Neighborhood of NBPF1.PNG 628 × 114; 9 KB
-
 Genomic context.png 521 × 102; 11 KB
-
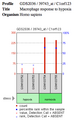
 GEO Profile for NBPF1.png 779 × 370; 8 KB
-
 Glucocerebrosidasa.png 640 × 434; 66 KB
-
 Interaccions establertes per LIGHT.jpg 2,338 × 1,700; 281 KB
-
 Localització subcel·lular de l'ATP13A2.jpg 520 × 417; 61 KB
-
 Location of C1orf94 on Chromosome 1.png 720 × 90; 1 KB
-
 Marcação alfa fucosidase celulas.jpg 374 × 686; 89 KB
-
 MRNA transcript variants.png 771 × 146; 27 KB
-
 Métabolisme du MTHFR.svg 584 × 287; 355 KB
-
 NBPF1 Paralogs Rooted Tree.gif 508 × 492; 5 KB
-
 NCBI Expression Data.png 1,040 × 354; 29 KB
-
 NCBI GEO data.png 1,053 × 373; 30 KB
-
 Nuclear Localization Signal for NBPF1.PNG 666 × 97; 9 KB
-
 Nuclear Localization Signal.PNG 659 × 97; 11 KB
-
 Orthologs of C1orf123.png 694 × 542; 87 KB
-
 Paralog of Human SH3D21.PNG 618 × 30; 3 KB
-
 PBB GE L1TD1 1457314 at tn.png 260 × 160; 3 KB
-
 PBB GE L1TD1 1457314 at.png 970 × 370; 49 KB
-
 PBB GE L1TD1 219955 at tn.png 285 × 160; 14 KB
-
 PBB GE L1TD1 219955 at.png 862 × 370; 44 KB
-
 Phylogenetic Tree of C1orf123 Orthologs.pdf 1,275 × 1,650; 55 KB
-
 PINK1 a la membrana.png 575 × 376; 23 KB
-
 PINK1 with healthy mitochondria.png 860 × 495; 41 KB
-
 Predicted DNA binding structure of NBPF1.png 714 × 190; 30 KB
-
 PRG4.pdf 1,891 × 1,247; 54 KB
-
 Rooted Phylogenic Tree of NBPF1 Orthologs.gif 535 × 350; 4 KB
-
 SH3D21 Phylogenetic Tree.PNG 445 × 544; 19 KB
-
 Structure of p11 protein 1BT6.png 1,440 × 1,080; 392 KB
-
 Table of FAM46B Ortholgs and Homologs.png 642 × 487; 213 KB
-
 Wikipedia Image 1.jpg 1,267 × 435; 72 KB
-
 Wikipedia Image 2.gif 1,255 × 397; 30 KB
-
 Wikipedia Image 3.jpg 310 × 317; 20 KB
-
 Wikipedia Image 4.gif 1,200 × 386; 29 KB
-
 Wikipedia Image 5.jpg 1,368 × 527; 138 KB


